

Improved analytics
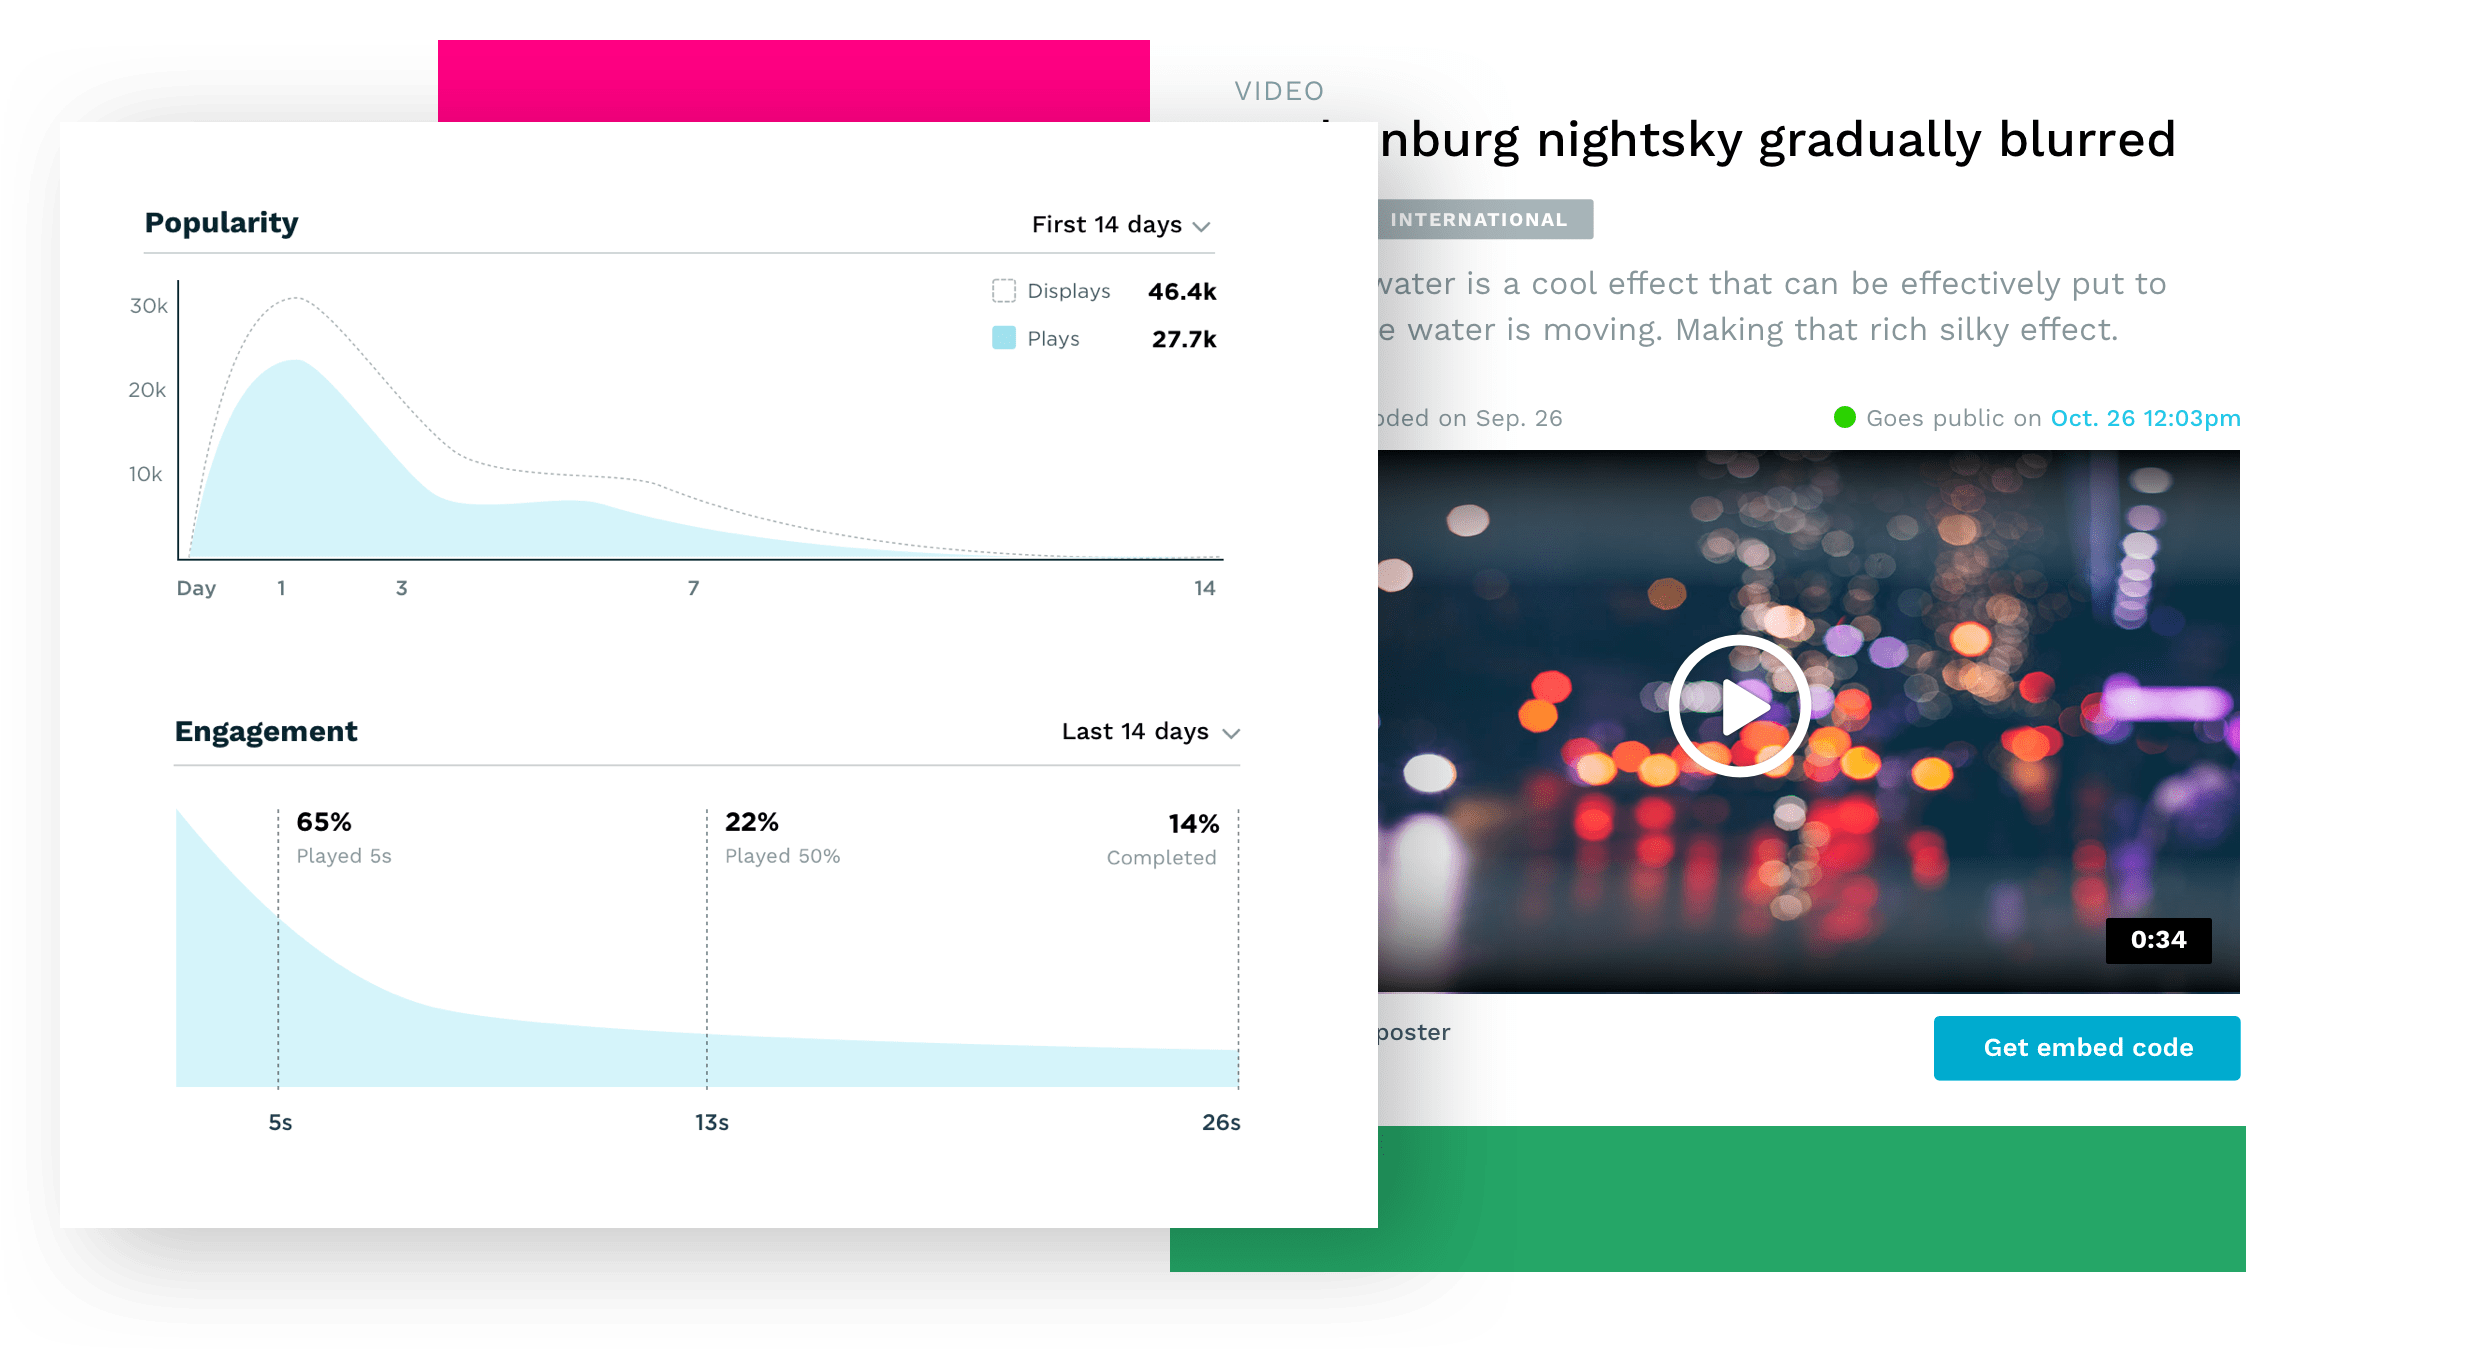
Plays over time
For news related content with a short shelf life, most of the views happen during the first few days after publishing the content.
For other content such as educational content, the majority of the views can actually be evenly spread across the timeline or clustered when certain courses are held. In case you want to have a longer time span you can get the displays and plays over the entire timeline of the video.
Engagement
Engagement relates to how interesting a video is. We look for the following metrics:
Play rate- the percentage of people who clicked to watch your contentAverage percentage watched- how large portion of the content did people watch on averageComplete rate- how many people finished watchingAverage time watched- how long did the average person watch the content
Play rate is a good measure to see if the video is being perceived as attractive and interesting based on where it is published and how it is promoted with a good poster image. Content with a play rate of less than 25% means that your content is not being seen or recognized as relevant to the audience.
On the other hand, a significant portion of the content has a play rate of 75+% which indicates either very relevant content or that some form of autoplay is used.
The next step is to figure out how long people view your content. Of course, it depends a lot on what the length of the content is as can be seen from this chart. We have decided to provide the engagement chart so you can see exactly where people leave your content or if they re-wind and watch a section again. This will guide you towards the right length of your content.
On above there is a good idea to make a shorter more focused video to keep the audience engaged and also position the content more prominently or in a better place to increase the play rate.
We also provide details on average time watched and average percentage watched so you can quickly compare videos of longer and shorter length.
Devices
Device information gives important information to optimize the length and format of your video. If most of your viewers are on the desktop you can generally create longer videos, whereas if the viewers are using mobile or handheld devices the video should generally be shorter.
Pages
When publishing content on multiple sites or using multiple video players we show you the sites or players that generated you the most video plays.
Real-time results
Real-time analytics is provided with 5-10 seconds delay, even for videos and live streams with millions of views. This allows you to see exactly how your content is performing right now.